A few notes on the samples:
The samples tested are pools of 3 individuals per group (EE2 treated or control) the samples were taken 7 days after treatment.  They were all ID'd as females by histology - but are definitely in very early stages of gonad development.
control sample IDs: 32, 28, 29
EE2 sample IDs: 22, 20, 16

The pooled DNA was fragmented 2 separate times (didn't have enough DNA from the first shearing), then combined prior to the MBD separation.  The MBD was performed 1x per sample.  

In terms of validating this assay on individuals:
There is only ~0.1g of tissue remaining for individual 22, so that is a total bummer.  Probably won't even be able to get DNA out of that for methylation analysis. The remaining sample either have DNA left over (20, 28 and 29) or at least enough tissue to get more DNA from (16, 32).

RNA-Seq plan:
-isolate RNA from 8 individuals (4 treated, 4 control) to performed RNA seq
-bought a qiagen kit to get RNA from tiny little samples, would like to test on one sample first and look at yield 

2nd analysis
(see below for 1st round of analysis)

From Jeff and Ryan
I've attached your results, which were generated via the following method, using the Bioconductor package, "Ringo":

* Read NimbleGen pair files into R
* Remove control probes
* Loess normalize each array (all ratios were formulated such that the estrogen treated sample is always in the numerator)
* Smooth log2 ratio values by computing a running median, using a window size of 600 bases
* Use a threshold of 2 fold change (log2(2) =1) for A02 and A03, and a less stringent threshold of 1.4 fold change in A01 (log2(1.4)=0.485), then detect peaks such that at least 3 adjacent probes must be above (or below (-2 and -1.4FC) for hypomethylation) threshold.
* Identify the overlap between A02 and A03, excluding A01 using the Bioconductor package "ChIPpeakAnno."

Of note, the overlapping DMRs detected in A02 and A03 are often different in size from one another.  In the results, I reported the coordinates and sizes of the DMRs from both A02 and A03, along with the coordinates and sizes of where A02 and A03 overlap.  Also, since a different normalization method and smoothing window size were used, new wig track files have been included in the results.

Please let me know if you'd like additional information.

Best,

Ryan


As a follow-up I asked about why the A01 samples had a different cut off and here is the reply: 
A lower threshold was used for the input vs input (A01) sample in an attempt to identify the most robust DMRs.  When using the same threshold for all samples, there were a large number of DMRs in A02 and A03, where the same, but slightly weaker pattern of logFC values was found.  

Using these criteria, there were 49 DMRs identified, 46 of them are in genes.  

gff: http://eagle.fish.washington.edu/bivalvia/array/2013.11.22.mgavery/mgaveryDMRs_112212.gff

I annotated them to the gene level (oyster CGI number) using intersectBed (bedtools) and then joined to SPID in SQLshare.  File can be found here: http://eagle.fish.washington.edu/bivalvia/array/2013.11.22.mgavery/DMRmgavery_mRNA_annotated.csv

I also determined how many CG were in each DMR using intersectBed (bedtools).  File (along with length of DMR) can be found here: 
http://eagle.fish.washington.edu/bivalvia/array/2013.11.22.mgavery/DMRmgavery_CG.xlsx

I spot checked a few of the DMRs by loading the wig files and DMR file into IGV.  There were 2 regions that seemed odd.  1 of the DMRs was only 1bp (scaffold41972, start 95274).  This was because the peaks identified for A02 only overlapped with A03 (both of these are MBD chips, dye swapped for treatment and control) for 1bp.  I will remove this DMR from further analysis since it is not robust.  I also looked at the scaffold43842 DMR.  This one was odd because there are no CG in the region.  When I looked at it in IGV, it look like it could be an artifact since the A01 sample also shows 2 out of 3 probes (but this DMR was retained because the stated criteria says it needs 3 probes in a row to meet the criteria in order to call it a peak.  I would like to not include this in further analyses as well.  I spot checked a few others and they looked pretty good, but what this tells me is that I should visually check all of the other regions to make sure they look robust. It is easier to look at these with the bed files in IGV as well to see where the peaks were called to start and stop.

The next step is to visually check all the regions, then do some further annotation (say to pathway level. initial iPath results only gave 2 genes that were in the pathways). --see below***

In the meantime, I did some pathway analysis with all the DMRs: when I plugged the genes into DAVID I didn't have any enriched groups (all genes on array as backgroun), but there were a few interesting KEGG pathways highlighted.  I think there is only 1 gene per pathway though.  A screenshot is below


***Visually check all DMRs:
After looking at each DMR individually there are 4 DMRs that I would remove because although the technically meet the thresholds, they are definitely finding loopholes in the overlapping process:
1. scaffold41972 HYPO - mentioned above, the overlap between A02 and A03 is only 1bp
2. scaffold1337 HYPER - only 2 probes where the A02 and A03 peaks overlap
3. scaffold219 HYPER - only 2 probes for A02 and A03 peaks overlap
4. scaffold43842 HYPER - The A01 did not meet the criteria for an enriched regions, but 2 out of the 3 overlapping probes were >1 for A01.

There are 45 DMRs remaining and 41 of them are in genes. 5 genes have 2 DMRs each, so there are 38 genes with DMRs.  One gene with a DMR also has a DMR in the promoter (CGI_10025861), the other 3 DMRs in promoters do not have DMRs in genes.

Here is where this annotated DMR file is saved (the links to IGV work if the saved xml session is loaded:
DMR file: http://eagle.fish.washington.edu/bivalvia/array/2013.11.22.mgavery/2013.11.22.mgaveryDMRs_visannotated.xls
xml session: http://eagle.fish.washington.edu/bivalvia/array/2013.11.22.mgavery/array_MG_session.xml

also joined these DMRs with other gene info (e.g. SPID, description, length of gene, #exons etc) and am starting to annotate them a little more here: http://eagle.fish.washington.edu/bivalvia/array/2013.11.22.mgavery/DMRvisAnnotated_CGIstats_TJGRGeneSPID.csv

Examples:
DMRs in cortotropin releasing factor receptor - promoter and first intron


5-hydroxytryptamine receptor 1B - middle exon


ATP binding cassete family - middle intron


"B" Grade DMR - no A01 peak, but similar pattern across the gene


1st analysis
analysis from R. Basom (from the Hutch):
I've attached your results, which were generated via the following method, using the Bioconductor package, "Ringo":

* Read NimbleGen pair files into R
* Remove control probes
* Tukey biweight mean center log2 ratios within each array (all ratios were formulated such that the estrogen treated sample is always in the numerator)
* Smooth log2 ratio values by computing a running median, using a window size of 1000 bases
* Within each array, use the log2 ratio distribution to calculate the threshold to be used for peak detection, then detect peaks such that at least 3 adjacent probes must be above threshold.

* Identify the overlap between A02 and A03, excluding A01 using the Bioconductor package "ChIPpeakAnno."   There are 96 regions from A02 that overlap with 99 regions from A03 - but not A01.

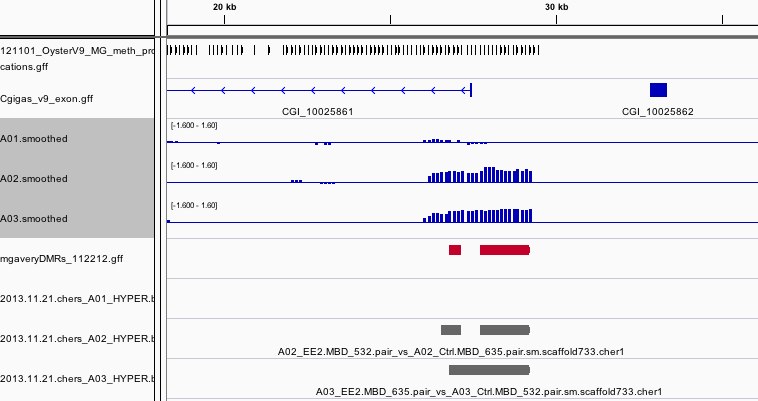
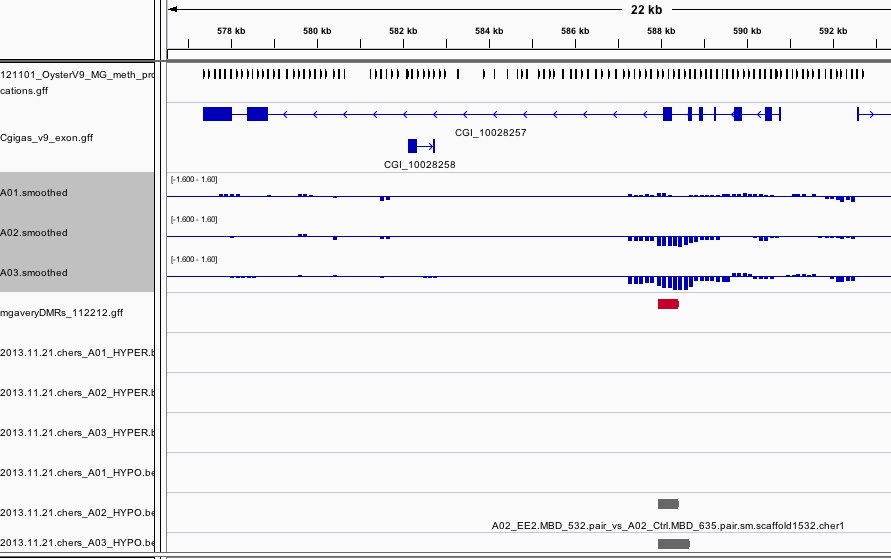
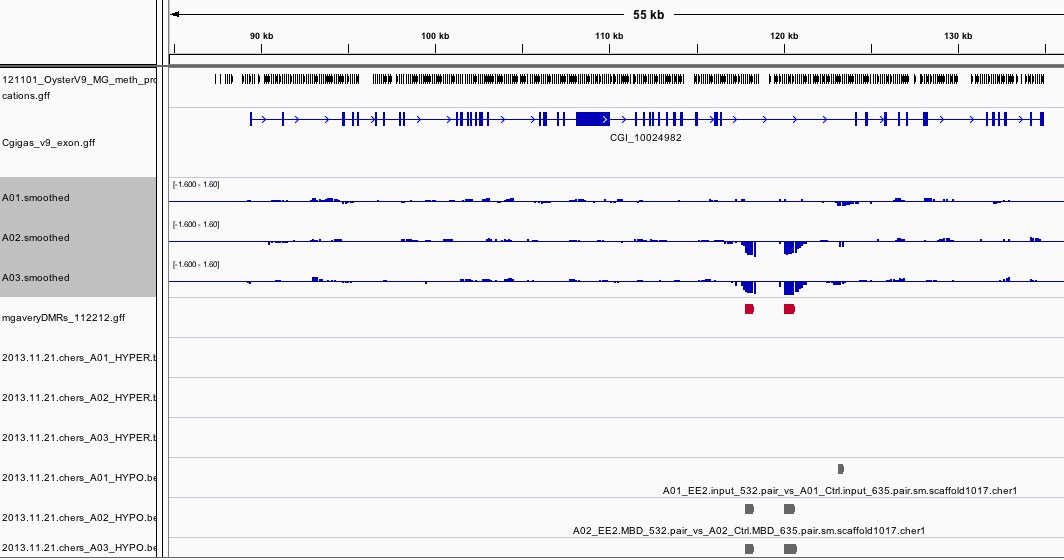
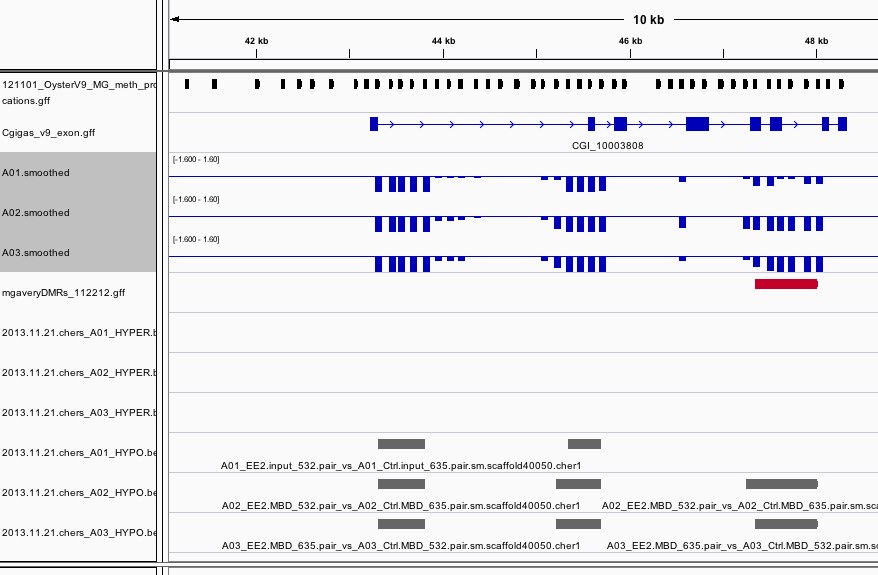
The results can be viewed in IGV.  If you don't already have an IGV genome configured for the Pacific Oyster, there's an IGVgenome subdirectory that contains one, though the oyster fasta file will have to be placed in this same directory (there are instructions in the README).  There's also a subdirectory of genomeBrowserTracks, that has wig files with the smoothed values from each array, as well as bed files with the peaks that were detected for A01, as well as files that have peaks that were detected in both A02 and A03, but not A01.  I've loaded the genome browser tracks into IGV and have done some configuration to assist with visualization.  If you'd like to use the configuration I've put together, you can load the session file that's attached in the results.  There's a screen shot to provide an example of how I've configured the tracks in IGV.  There's also an Excel file that has the 96 regions from A02 that overlap with A03, but not A01.  If you already have IGV open, this file has a column of hyperlinks that can be clicked on to direct IGV to each overlap region.
folder: http://eagle.fish.washington.edu/bivalvia/index.php?dir=array%2F2013.09.27.mgavery%2F


Hypermethylated Regions:

Analysis with mRNA hits 
91 regions overlapped w/ mRNA

genefish:bin Mackenzie$ ./intersectBed -a /Volumes/web-1/bivalvia/wholegenomefiles_MBDbsSeq_gill/gffs/oyster_v9_glean_final_rename_mRNA.gff -b /Volumes/web-1/bivalvia/array/2013.09.27.mgavery/2013.09.27.A03overlapWithA02.bed > /Volumes/web-1/bivalvia/array/arrayRegions_mRNA.txt
genefish:bin Mackenzie$ wc /Volumes/web-1/bivalvia/array/arrayRegions_mRNA.txt 
      91     819    6013 /Volumes/web-1/bivalvia/array/arrayRegions_mRNA.txt

Pulled the 91 regions into galaxy and imported fasta of oyster genes (oyster_v9_gene.fasta)

Did a fasta to tabular, joined on the gene ID, cut the gene ID and sequences only to a new file and converted tabular to fasta.

fasta of genes with differential methylation can be found here: http://eagle.fish.washington.edu/bivalvia/array/genesWithDiffMeth.fasta

SAME ANALYSIS as above BUT W/ all gene hits (i.e. mRNA)
82 unique SPIDs went into DAVID (((here is link to all annotated regions (duplicates were removed before being put into DAVID) http://eagle.fish.washington.edu/bivalvia/array/arrayRegions_mRNA_annotated.txt  )))
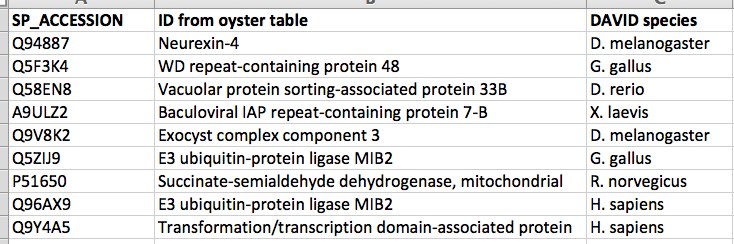
82 SPIDs put in, given 76 DAVID IDs
ALL OYSTER GENES ARE USED AS BACKGROUND  ~~SEE BELOW FOR ONLY GENES ON THE ARRAY AS BACKGROUND


these processes include 9 SPIDs, which are annotated here: http://eagle.fish.washington.edu/bivalvia/array/genesID_DAVIDenrichment_mRNA.xlsx
snapshot

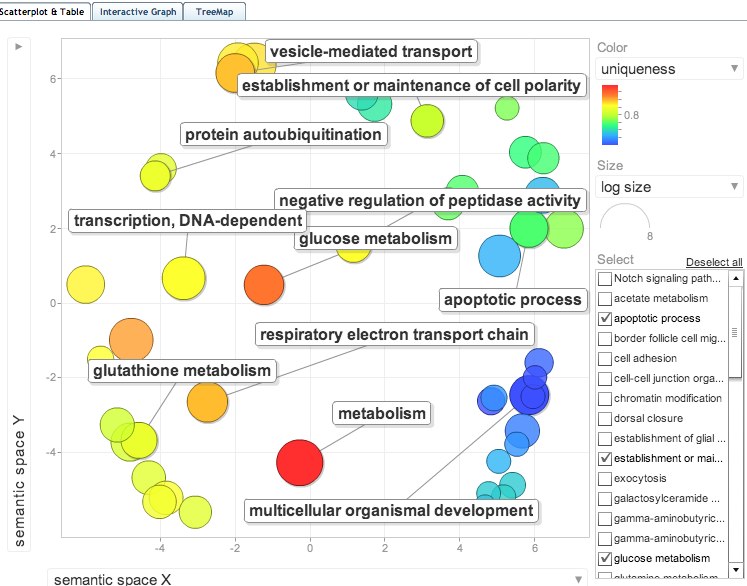
joined the SP_accessions to GO terms in SQLshare and put GO terms into ReviGO.  Visualization below:


DAVID with only genes on array (http://eagle.fish.washington.edu/bivalvia/array%20design/GenesOnArray_SPIDs_only.csv) as background


Not many differences from above (Check significance after correction, none are below 0.05) Only addition is regulation of neurotransmitter levels.  The EXACT SAME 9 SPIDs contributed to the enriched categories  so the ReviGO plots above would be the same.


Hypomethylated Regions:
As it turns out the above 96 regions are hypermethylated in the EE2 treated sample, there are another 287 regions that are hypomethylated in the EE2 treated.

When joined to mRNA 268 regions overlapped with mRNA (these may not be unique regions of the 287 since mRNAs also overlap)

I identified the genes that overlapped with these hypomethylated regions and annotated them to their SPIDs.  There were 201 unique SPIDs  in this list.  I used those as the gene list and all genes on the array as background for enrichment analysis in DAVID

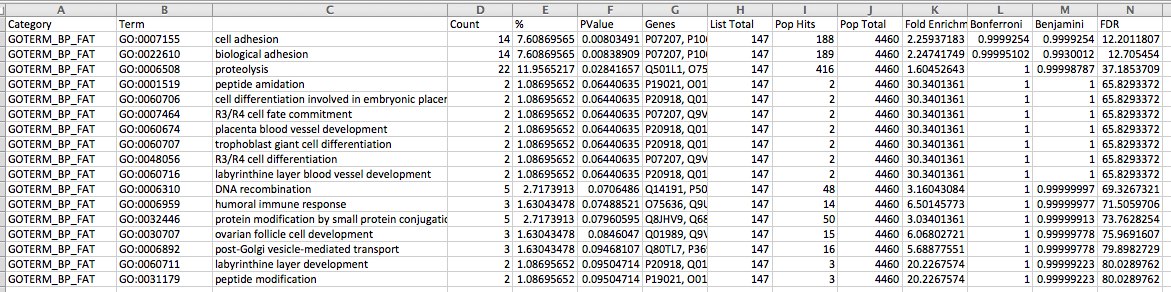
Here is the output of enriched processes:
http://eagle.fish.washington.edu/bivalvia/array/2013.10.03.mgaveryHypomethlated/DAVIDenrichment_hypomethinEE2.txt
Here are the enriched gene IDs:
http://eagle.fish.washington.edu/bivalvia/array/2013.10.03.mgaveryHypomethlated/DAVIDenrichment_hypomethinEE2.txt


11/01/13

I am interested in seeing if the differentially methylated regions are primarily in exons or introns or if they cross an intron exon boundary:

Initial summary:
96 hypermethylated regions (compared to control): 90 overlapped with mRNA
287 hypomethylated regions : 256 overlapped with mRNA
~~it is not surprising that this may overlapped with genes since the tiling array was designed to cover genes (+2kb upstream)~~

How many regions overlapped with intron/exon boundaries??
First, designed a gff to span 10 bp upstream from an intron (aka 10 bp upstream of an exon intron boundary):

bedtools code: genefish:bin Mackenzie$ ./flankBed -i /Volumes/web-1/trilobite/Crassostrea_gigas_v9_tracks/Cgigas_v9_intron.gff  -g /Volumes/web-1/cnidarian/qDOD_scaffold_length.txt  -l 10 -r 0 > /Volumes/web-1/bivalvia/array/flankIntron.txt

Then, performed an intersect bed to count the number of times a differentially methylated region intersected one of these boundaries

bedtools code for hypermethylated: genefish:bin Mackenzie$ ./intersectBed -c -a /Volumes/web-1/bivalvia/array/2013.09.27.mgavery/2013.09.27.A03overlapWithA02.bed -b /Volumes/web-1/bivalvia/array/flankIntron.gff > /Volumes/web-1/bivalvia/array/2013.09.27.mgavery/intersect_boundaries_hypermeth.txt

bedtools code for hypomethylated: genefish:bin Mackenzie$ ./intersectBed -c -a /Volumes/web-1/bivalvia/array/2013.10.03.mgaveryHypomethlated/2013.10.03.A03overlapA02_butNotA01_hypomethylated_bed.bed -b /Volumes/web-1/bivalvia/array/flankIntron.gff > /Volumes/web-1/bivalvia/array/2013.10.03.mgaveryHypomethlated/countofboundary_hypometh.txt 

Summary:
Of the 90 hypermethylated regions overlapping with a gene 47 (or 52%) crossed an intron/exon boundary  (a majority only crossed one boundary, but up to 6 boundaries were crossed by a single region)

Of the 256 hypomethylated regions overlapping with a gene 122 (or 48%) overlapped 1 or more boundaries (similar to hypermethylated regions, a majority only crossed one boundary, but up to 6 boundaries were crossed by a single region)

How many differentially methylation regions overlap ONLY with coding regions?

I pulled out the subset of regions that did overlap with mRNA, but did NOT overlap with an exon/intron boundary and performed an intersect bed to count how many regions overlapped with just an exon (and can also draw conclusions that those that do not overlap only overlap with an intron).

hypermethylated: there were 43 regions that overlapped with mRNA, but did NOT cross an intron/exon boundary.  I did 2 intersectBed with these 43 regions - 1 with the exon.gff 1 with the intron.gff.  What I found was the 32 overlapped with an intron only 6 overlapped with an exon only and an additional 5 came up as intersecting with both an intron and an exon (this probably has something to do with the gff I created to identify boundaries (only 10bp upstream from intron). 
But! to summarize: 96 regions: 90 are in genes (52 cross exon/intron boundary another 32 are in introns only and 6 are just in exons), 6 are outside of gene

hypomethylated: there were 134 regions that overlapped with mRNA, but did NOT cross an intron/exon boundary.  I did 2 intersectBed with these 134 regions - 1 with the exon.gff 1 with the intron.gff.  What I found was the 114 overlapped with an intron only 4 overlapped with an exon only and an additional 16 came up as intersecting with both an intron and an exon (this probably has something to do with the gff I created to identify boundaries (only 10bp upstream from intron). 
But! to summarize: 287 regions: 256 are in genes (138 cross exon/intron boundary another 114 are in introns only and 4 are just in exons), 31 are outside of gene

files I worked with:
intron and exon canonical files in trilobite
intron/exon boundary gff I generated (described above)
generated bed files with 


How big are these regions?
min: 231 bp 
max: 7,979 bp
average: 983 bp

Determine how to validate these?
-Is there a way to pick the 'best' regions to validate? (log2s?)
-How much would it cost to do pyrosequencing of these regions?

How many CG sites per regions?

Did some intersect beds
1. count the number of CG per DMR
genefish:bin Mackenzie$ ./intersectBed -c -a /Volumes/web-2/bivalvia/array/2013.09.27.mgavery/2013.09.27.A03overlapWithA02.bed -b /Volumes/web-2/trilobite/Crassostrea_gigas_v9_tracks/Cgigas_v9_CG.gff >/Users/Mackenzie/Desktop/hyperarray_CG.txt 
2. overlap DMR with mRNAs using the -wb option to get gene id for each DMR 
genefish:bin Mackenzie$ ./intersectBed -wb -a /Volumes/web-2/bivalvia/array/2013.09.27.mgavery/2013.09.27.A03overlapWithA02.bed -b /Volumes/web-2/trilobite/Crassostrea_gigas_v9_tracks/Cgigas_v9_gene.gff   >/Users/Mackenzie/Desktop/hyperarray_mRNA.txt 
3. Then joined these in SQL share to get the length of regions, number of CG and gene ID for these DMR.  The file is saved here: http://eagle.fish.washington.edu/bivalvia/array/2013.09.27.mgavery/hyper_CG_mRNA_annotated.csv


Interestingly, 3 of the regions did not contain a CG.  Why were they identified as being differentially methylated?